AI Agent Monitoring: Metrics, Logs, and Stop Conditions
Why did the agent fail if every API call returned 200?
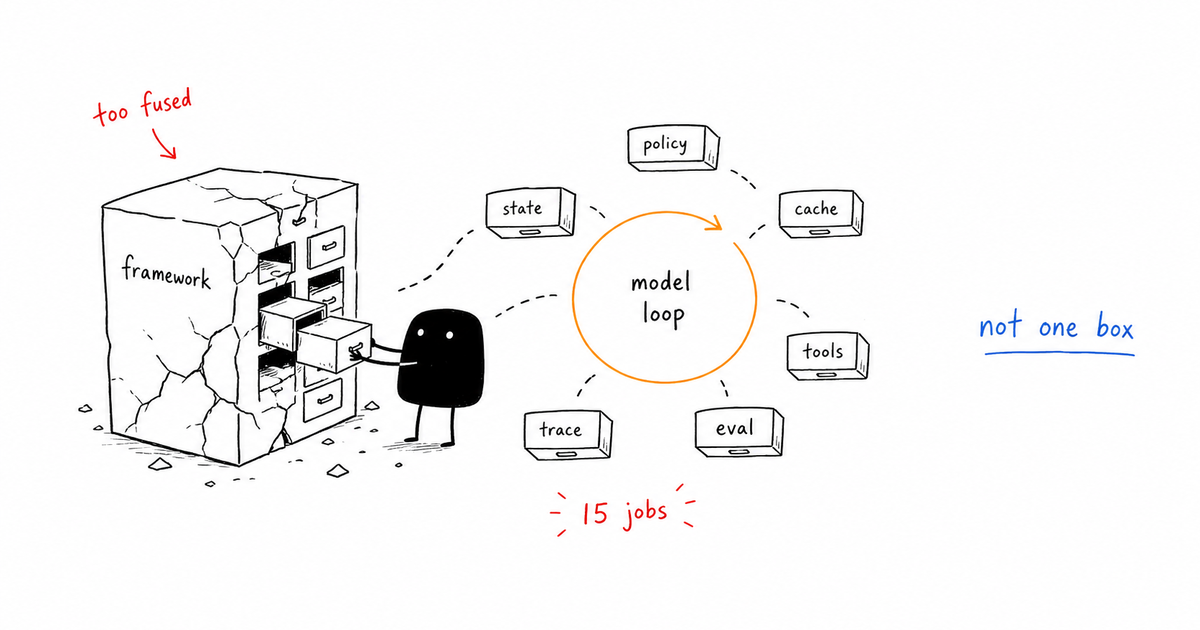
The tempting answer is to monitor uptime, latency, and error rate like a normal backend service. That answer is not useless, but it is too vague to operate. AI agent monitoring is the practice of tracking agent turns, tool calls, model latency, token cost, retries, loops, policy decisions, and final outcomes. It matters because agent failures often look like successful requests unless the monitor knows what the agent was trying to do.
Direct answer
AI agent monitoring is the practice of tracking agent turns, tool calls, model latency, token cost, retries, loops, policy decisions, and final outcomes. It matters because agent failures often look like successful requests unless the monitor knows what the agent was trying to do.
Data note
When this matters
- A workflow can complete with the wrong output and no exception.
- The agent uses tools repeatedly, retries silently, or streams partial progress to users.
- Cost, latency, approval, and quality need to be managed per turn instead of per endpoint.
Failure modes this page should catch
- Looping: the agent calls the same tool until budget is exhausted.
- Silent drift: answer quality drops while uptime stays green.
- Tool mismatch: the agent uses a safe tool for the wrong job.
- Cache regression: stable context moves and cost rises without a product change.
- Approval escape: risky work completes without hitting the human gate.
Monitoring runbook
| Gate | Signal | Action |
|---|---|---|
| Turn status | done, error, paused, budget-stopped | Alert on unknown or stale states |
| Tool-call rate | calls per turn and repeat calls | Stop repeated calls after threshold |
| Cost meter | input, output, cache read, cache write | Alert on cost per turn spike |
| Policy result | allow, deny, approval | Block missing policy decisions |
| Outcome signal | eval pass, user accept, publish verify | Fail closed on missing outcome |
Running example
The monitor sees a turn with 14 repeated search calls, rising token cost, and no new evidence objects. It stops the run as loop risk, preserves the trace, and asks for a narrower query instead of letting the agent spend another ten minutes.
Copy the working template
Use the monitoring runbook above as the v1 artifact for this page. Replace the placeholders with your own agent names, tools, risk classes, and thresholds, then link the result back into your monitoring, tracing, security, and evaluation gates.
How this connects to the control-gates library
- AI Agent Control Gates: Stop Bad Agents Before They Act
- Agent Observability: Trace What Agents Decide and Do
- Agent Tracing: A Practical Schema for Tool-Using AI
- AI Agent Evaluation: Gates That Catch Bad Behavior
- Prompt Caching: Cut Agent Cost Without Breaking Quality
Frequently Asked Questions
What should AI agent monitoring include?
AI agent monitoring should include turn state, tool calls, model latency, token cost, cache usage, policy decisions, retry behavior, eval results, and final outcome verification.
How is monitoring different from observability?
Monitoring tells you when a signal crossed a threshold. Observability gives you enough trace detail to explain why the threshold was crossed and what the agent did next.
What is the first stop condition to add?
Add loop and budget stops first. They are easy to measure and prevent agents from turning a small ambiguity into repeated tool calls and uncontrolled cost.
The Takeaway
Monitoring is not the dashboard. Monitoring is the set of signals that can stop the agent before a normal-looking request becomes an expensive wrong answer.