Agent Tracing: A Practical Schema for Tool-Using AI
What would you need to know to replay the agent’s mistake?
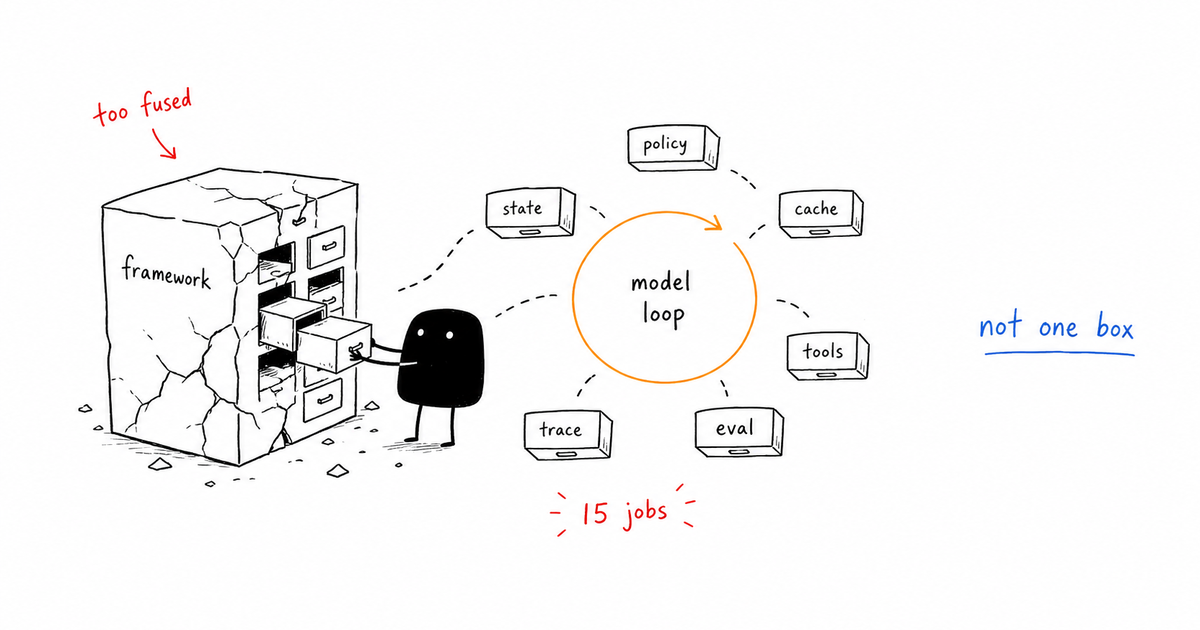
The tempting answer is to log the final answer and maybe the tool response that came before it. That answer is not useless, but it is too vague to operate. Agent tracing records the ordered events inside an agent run: input, selected context, model calls, tool calls, policy decisions, costs, evaluations, approvals, artifacts, and final state. A good trace makes the failure replayable without reading an entire chat transcript.
Direct answer
Agent tracing records the ordered events inside an agent run: input, selected context, model calls, tool calls, policy decisions, costs, evaluations, approvals, artifacts, and final state. A good trace makes the failure replayable without reading an entire chat transcript.
Data note
When this matters
- A single user request can produce many model and tool events.
- Engineering, security, and support need the same evidence trail.
- You want monitoring alerts to point to a debuggable trace, not a log pile.
Failure modes this page should catch
- Trace ids are not stable across retries.
- Tool outputs are logged without the permission mode that allowed them.
- Costs are aggregated daily instead of attached to each turn.
- Approvals happen in Slack or email and never rejoin the trace.
Agent trace event schema
| Gate | Signal | Action |
|---|---|---|
| Identity | trace_id, turn_id, user_id, agent_id | Create before model call |
| Context | system hash, memory keys, source ids | Store enough to reconstruct |
| Step | model, prompt hash, tool, result | Append in order |
| Control | policy, eval, approval, stop condition | Record decision reason |
| Outcome | artifact, external mutation, verification | End with named state |
{
  "trace_id": "trace_01",
  "turn_id": "turn_01",
  "event_type": "tool_call",
  "sequence": 4,
  "agent": "research_agent",
  "tool": {"name": "fetch_url", "risk": "read_only"},
  "policy": {"decision": "allow", "rule": "source_fetch"},
  "input_hash": "sha256:...",
  "output_ref": "artifact://trace_01/source_04",
  "cost": {"input_tokens": 1200, "output_tokens": 220},
  "timestamp": "2026-06-16T18:37:35Z"
}
Running example
A deployment agent publishes the wrong branch. The trace should show the requested branch, resolved branch, shell command, approval packet, deploy result, and post-deploy verification. If one field is missing, the incident review becomes guesswork.
Copy the working template
Use the agent trace event schema above as the v1 artifact for this page. Replace the placeholders with your own agent names, tools, risk classes, and thresholds, then link the result back into your monitoring, tracing, security, and evaluation gates.
How this connects to the control-gates library
- AI Agent Control Gates: Stop Bad Agents Before They Act
- Agent Observability: Trace What Agents Decide and Do
- AI Agent Monitoring: Metrics, Logs, and Stop Conditions
- AI Agent Evaluation: Gates That Catch Bad Behavior
- Human Approval for AI Agents: When Agents Should Stop
Frequently Asked Questions
What is agent tracing?
Agent tracing is the structured event log for an agent run. It records the sequence of context, model, tool, policy, cost, eval, approval, and final-action events.
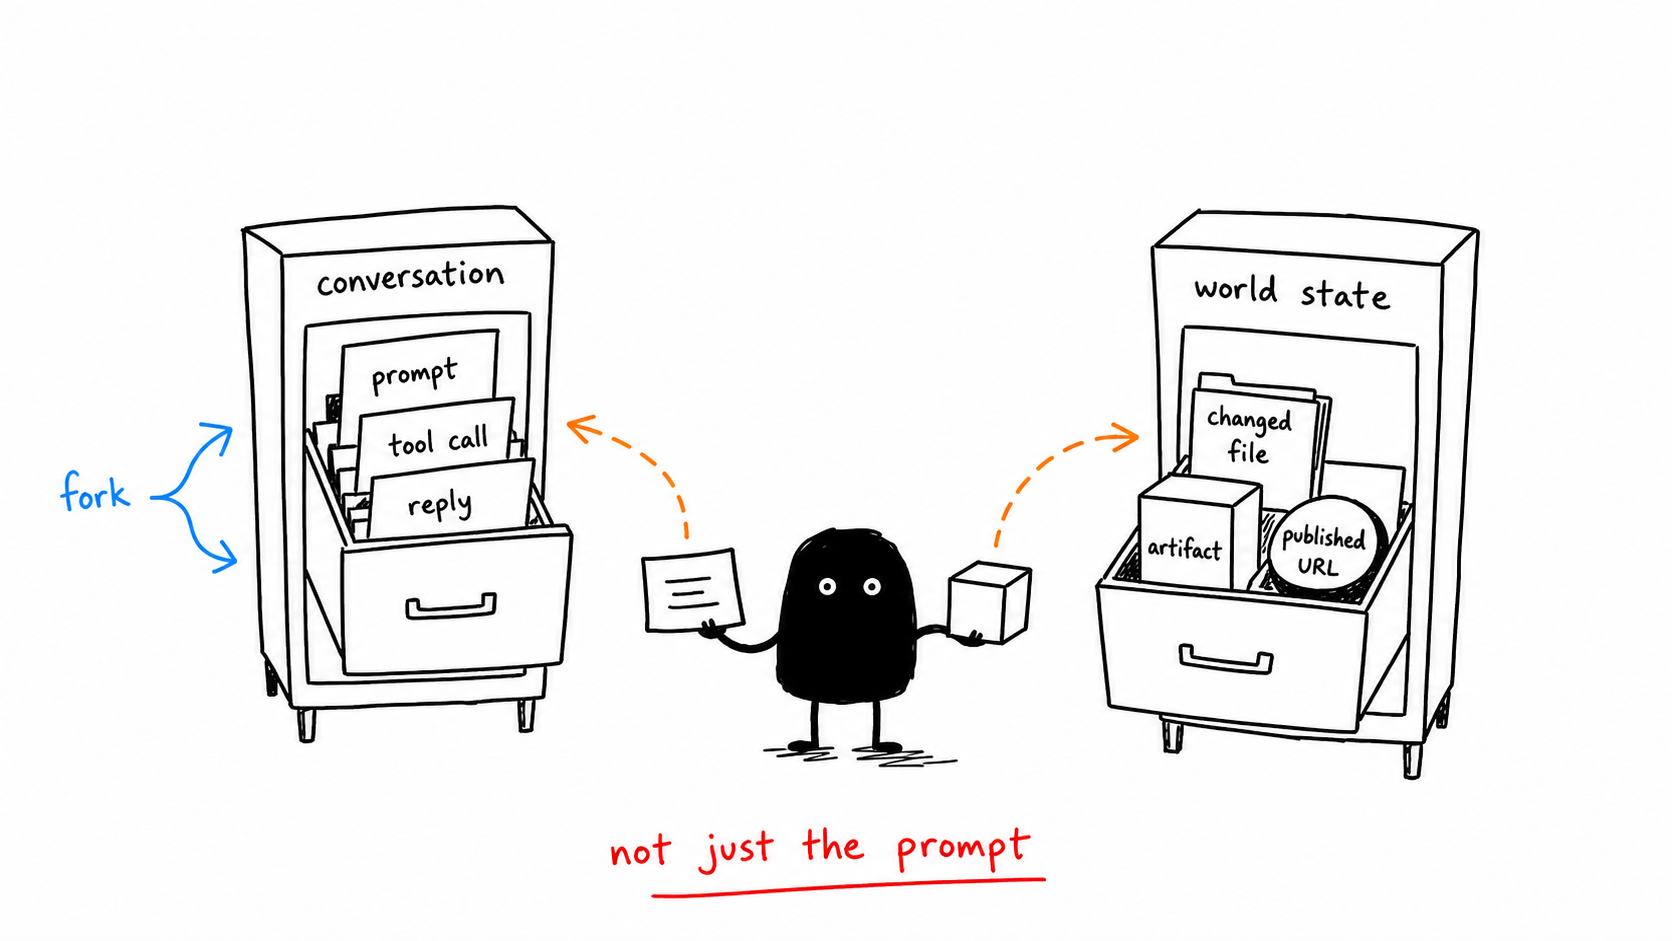
How is LLM tracing different?
LLM tracing usually centers on model spans. Agent tracing includes model spans but also tracks tools, permissions, workflow state, artifacts, and human decisions.
What is the minimum useful trace?
A minimum useful trace has stable ids, ordered events, selected context, tool inputs and outputs, policy decisions, token cost, eval result, approval state, and final outcome.
The Takeaway
A trace is useful when it can answer the incident-review question: what did the agent see, decide, do, and verify?